Disclaimer: Data present in this research is only relevant just at this particular moment, i.e. March 2018.
Introduction
If you missed previous parts (1, 2), I totally recommend you to visit them, as they cover some good general stuff:
- General popularity of ICO rating services
- ICO rating coverage and current trends
- ICO listings uniqueness
- ICO ratings distribution and “aggressiveness”
The list of List of reviewed ICO rating services is the same as for part 2, so I will not repeat it here.
ICO ratings deviation
After we matched all ICO listings, now it is possible to see some interesting metrics of how the same ICO is rated across various services.
What is the average ICO rating deviation across ICO rating services?

Which ICOs have maximum rating deviation?

The most controversial ICO EiraCube is actually considered by some people to be a scam. So no wonder that it got some of the most extreme ratings.
Which ICOs have minimum rating deviation?

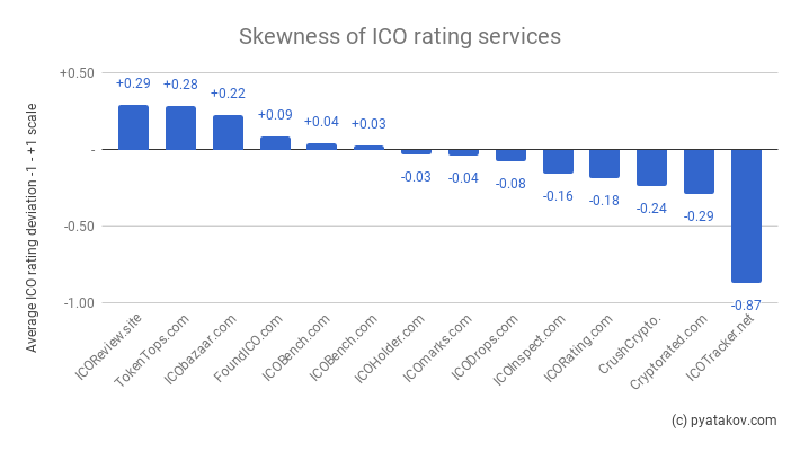
ICO ratings services skewness
How on average ICO services deviate ratings from average for the same ICOs?
There are two charts one for all “score-type” ratings and one for all ratings combined. Rules for grading are the same as in Part 2 of the research.
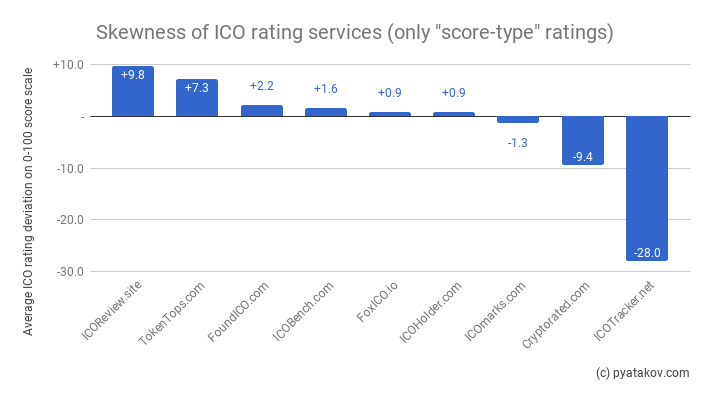
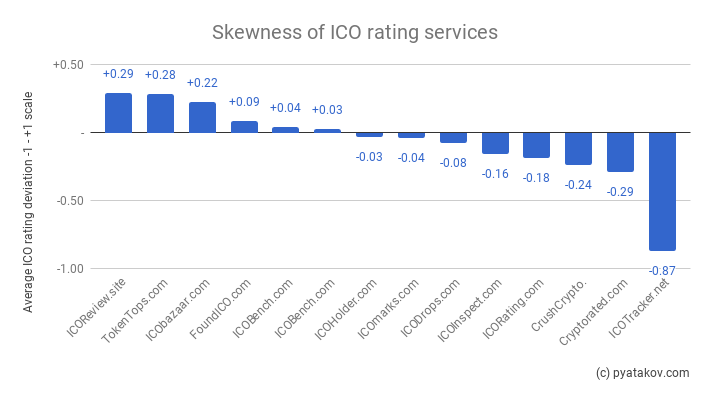
Interesting that 2 services with greater listings (ICOBench.com and ICOHolder.com) are right in the middle of the pack.
ICO ratings services similarity
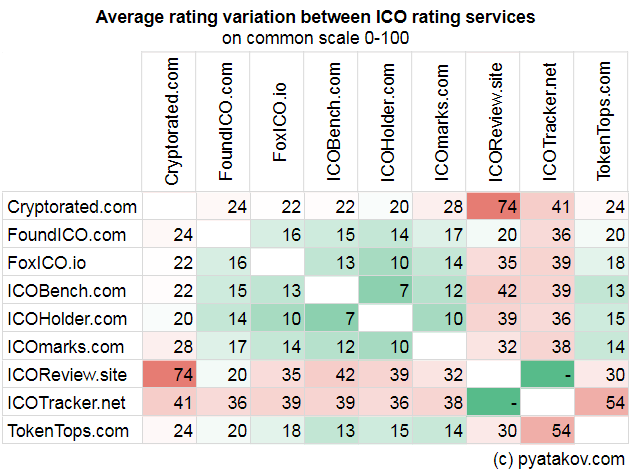
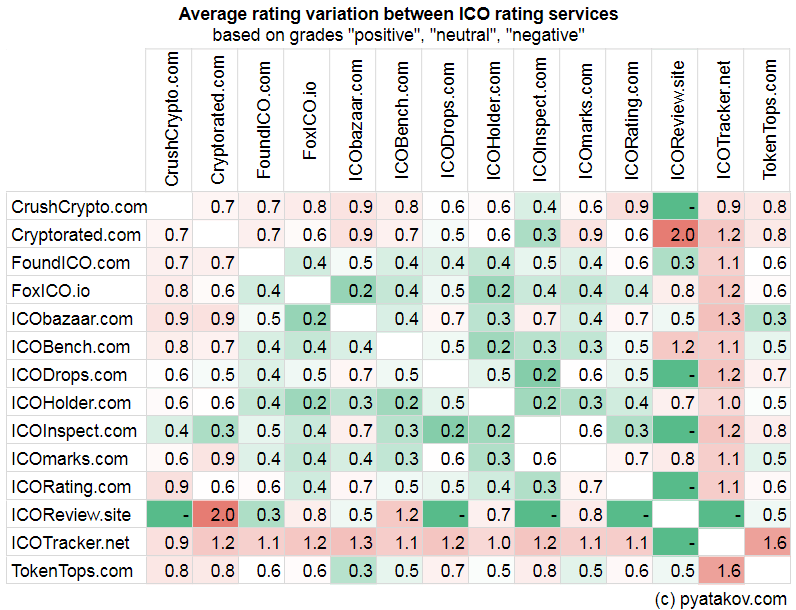
Is there any correlation between ICO rating services?
For this I will take ICO rating services in pairs and measure how are rating for the same ICO differ between the paired services.
On the following chart the lesser the number the more alike the ratings from two selected ICO rating services are.
Bonus: ICOBench - Experts vs Profile ratings
As ICOBench.com calculates its overall rating based on two components:
- “Profile rating” based own rating methodology
- Community Experts rating
I really wanted to see how are these different from each other.
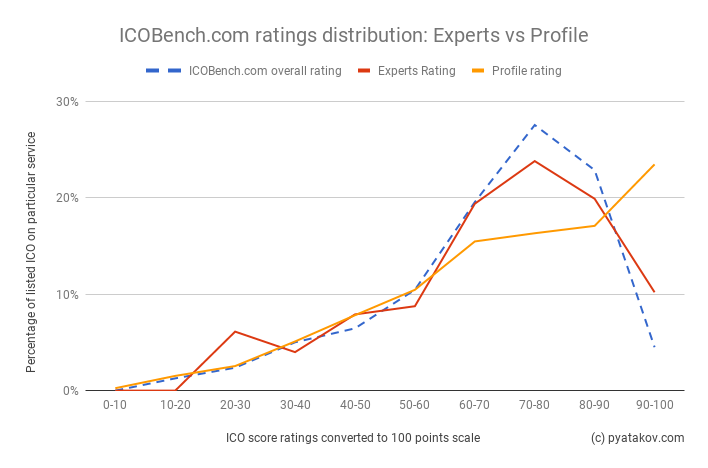
On average Experts and Profile ratings for the same ICOs do in fact differ:
- Variance: 0.8 on “5.0 scale”
- Average difference: -0.15 on “5.0 scale” (i.e. Experts on average rate ICOs 0.15 points lower that Profile ratings)
Conclusions
Key conclusions after all 3 parts of ICO rating research:
- Mass creation of ICO rating services started in Summer-Autumn 2017, with skyrocketing popularity in Winter 2017-2018.
- There are two leaders in terms of popularity ICOholder.com, ICObench.com which are well ahead of competitors in terms of web traffic and page ranks.
- Top sites do have approx. 2000+ ICOs listed and 1000+ ICOs rated.
- Most popular way to rate an ICO is using own rating methodology. Few sites rely on community experts ratings or rating aggregation.
- There seems to be no full listing copying, yet ICO rating services with smaller listings tend to focus on most popular ICOs present on other sites.
- “Score-based” ratings average value is not 50%, yet more like 60-70% of maximum.
- General average deviation for ratings is like 10-20%, yet there are enough controversial ICOs with really big rating magnitude.
- Rating services skewness is in fact statistically observed.
- Biggest services are in general not relatively skewed. In general the bigger the listing size is, the less skewness is present.
Thanks for reading. Feel free to subscribe and comment here or on other social platforms.
