Disclaimer: Data present in this research is only relevant just at this particular moment, i.e. beginning of March 2018.
Introduction
If you missed Part 1, I totally recommend you to look through it, as it covers some good introductory stuff:
- General popularity of ICO rating services
- ICO rating coverage and current trends
In this part I am going to overview a narrower list of 14 ICO rating services, which have relatively larger ICO listing size (200+ ICOs).
List of reviewed ICO rating services:
| ICO rating service | Rating type |
|---|---|
| CrushCrypto.com | Grades |
| Cryptorated.com | Scores |
| FoundICO.com | Scores |
| FoxICO.io | Scores |
| ICObazaar.com | Grades |
| ICOBench.com | Scores |
| ICODrops.com | Grades |
| ICOHolder.com | Scores |
| ICOInspect.com | Grades |
| ICOmarks.com | Scores |
| ICORating.com | Grades |
| ICOReview.site | Scores |
| ICOTracker.net | Scores |
| TokenTops.com | Scores |
I also indicated rating type used by particular service: “Scores” (e.g. “4.5” or “87%”) or “Grades” (e.g. “AA+” or “Positive”). For some metrics I analyzed only “Score-type” ratings, as they allow much more precise analysis and greatly limit grading biases.
Small disclaimer. Different services tend to name the same ICO in a different way. Although I manually reduced more than 400 different ICO titles to common standards, there may still be minor errors in proper identification of the same ICO across different services for ICOs listed only on 1 or 2 services.
ICO listings uniqueness
After normalizing ICO names, I identified ~4.600 distinct ICO.
How popular is the same ICO across different ICO rating services?
The numbers on the chart are cumulative, meaning that ICOs that are listed on [N] sites also included in [N+] categories.
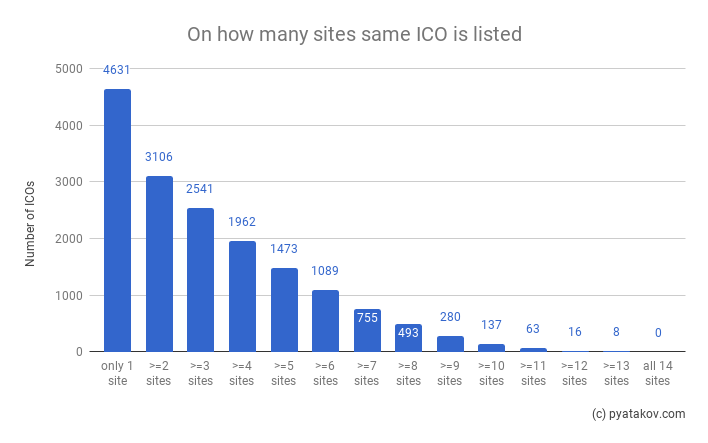
Interesting that no ICO was listed on all 14 services. The service which did not list any of the more “popular” ICO was ICOReview.site.
The 8 most popular ICOS which are present on 13 of 14 ICO rating sites are:
- Auctus
- DADI
- INS
- Experty
- CREDITS
- WePower
- EQUI
- Monaco
How unique are ICO listings across ICO rating services?
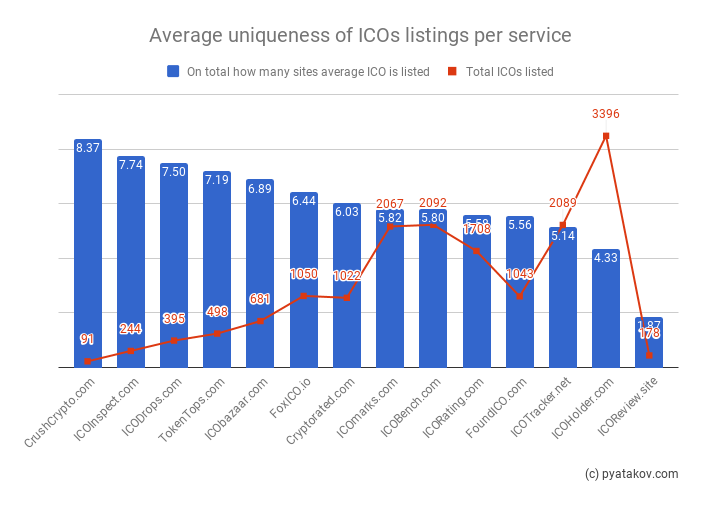
Another way is to examine the distribution of ICO listing portfolio.
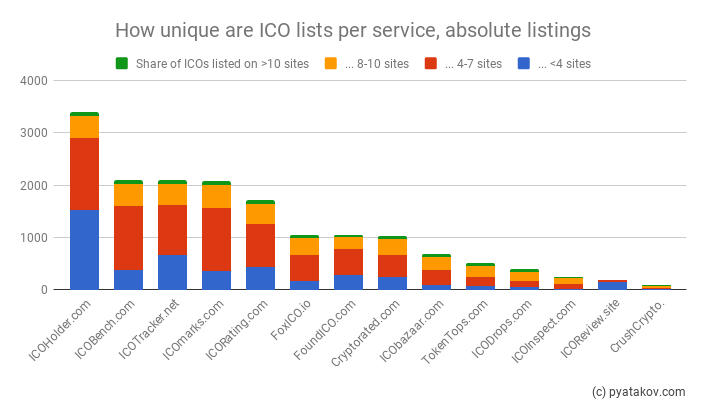
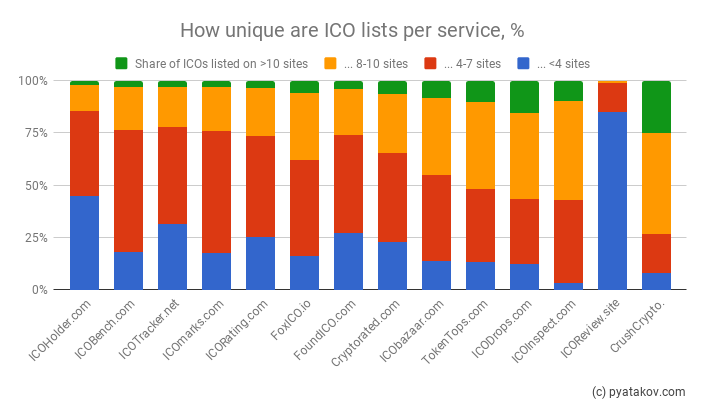
There is observable correlation between listing size and uniqueness, as services with limited resources prioritize rating more popular ICOs in order to attract web traffic.
The one who breaks out again is ICOReview.site, which doesn’t feature most popular ICOs and has quite unique portfolio.
ICO ratings distribution
How on average ratings are distributed?
For next couple metrics I will focus on “Score-type” ratings based on reasons I mentioned before. All scores were brought to common scale of 0-100, i.e. “4.5 of 5” equals “90 of 100”.
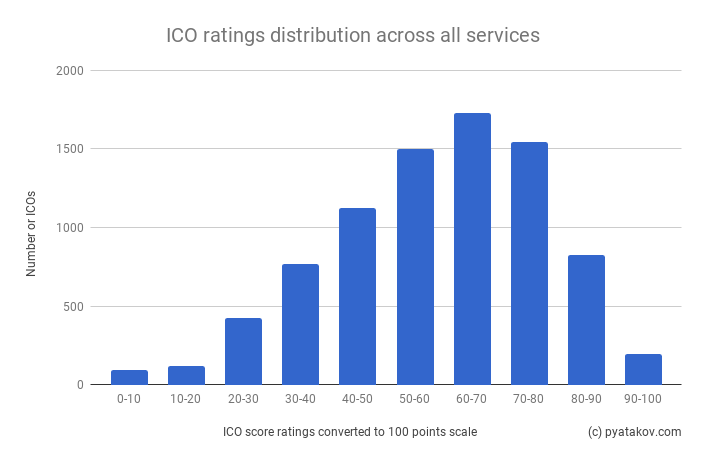
Average ICO is rated closer to the upper bound, yet IMO such distribution is common for all score base ratings in various areas.
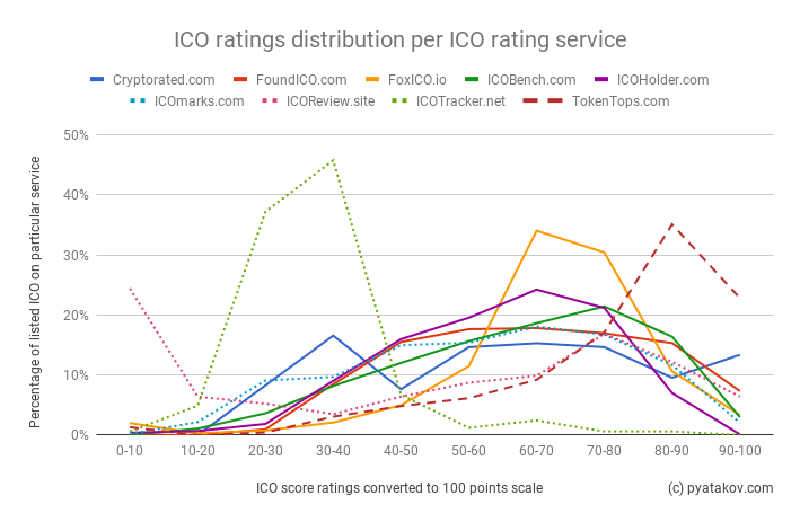
How ratings are distributed per service?
If we take a look at each ICO rating service individually, they do in fact have different distributions.
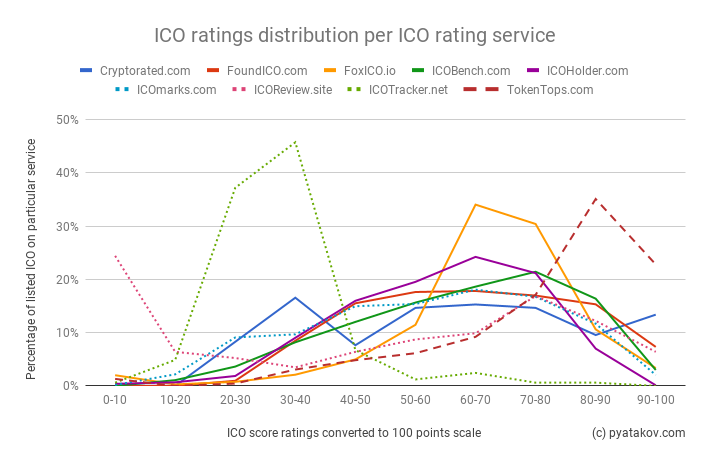
As for the most deviation from the average:
- Cryptorated.com seems to have most even rating distribution
- TokenTops.com ratings are quite skewed to the positive values
- ICOTracker.net and ICOReview.site have their peaks at quite lower rating values
How aggressive or gracious are ICO rating services?
We can measure aggressiveness of a rating methodology and listing strategy by examination of the distribution of “positive” and “negative” ratings. This will also allow to factor in “Grade-type” ratings.
For the chart below, I made the following assumptions, based on my own perception of rating scales:
- For “Score-type” ratings:
- ≥ 80 of 100 = “Positive”
- < 40 of 100 = “Negative”
- For “Grade-type” ratings:
- “A” or “Positive” or “High” = “Positive”
- Lowest letter grade or “Negative” or “Low” = “Negative”
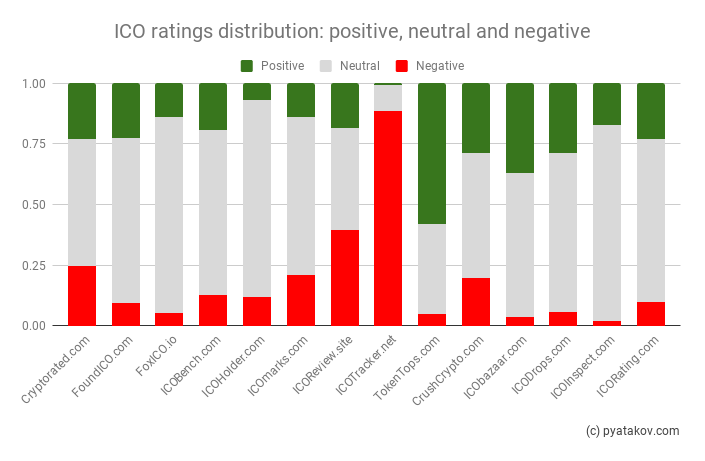
We already observed skewness of some “Score-type” ICO rating services, yet now it is more obvious.
As for “Grade-type” ratings, there is some indication, that they have on average slightly higher share of positive ratings than “Score-type” services.
Conclusion
The majority of services seem alike, with some really differentiating ones, which have their own listing selection or methodology skewness.
At first I was going to also include in part 2 of the research some insights on how the same ICOs are rated across different services and methodologies. Yet as I realized that this post was going too big both to write and to read, I decided to carry it to part 3.
Thanks for reading. If you have any questions or ideas, please feel free to comment this post or contact me directly.